NGDB contained multiple iron oxide columns
NGDB stored iron measurements across multiple fields, making it difficult to compare samples consistently. DOGAMI needed a single FeOt value that could be used across datasets.
Customer Project · DOGAMI
DOGAMI used the LithoX Exploration Data Workspace to analyze rock geochemistry from the USGS NGDB and DOGAMI OGDC-8 datasets for a public poster presentation focused on identifying areas potentially prospective for stimulated hydrogen (H₂).
Rather than spending time cleaning and reconciling datasets, the team started with preloaded and standardized geochemistry data already available in LithoX. They reviewed the standardizations, verified the lineage, and moved directly into analysis.
The challenge
For this project, two common issues needed to be solved:
NGDB stored iron measurements across multiple fields, making it difficult to compare samples consistently. DOGAMI needed a single FeOt value that could be used across datasets.
OGDC-8 contained many variations of rock names but no standardized field identifying igneous rocks. To focus the analysis, the team needed a reliable way to identify and filter igneous samples.
Exploration Data Workspace
LithoX already contained standardized NGDB and OGDC-8 geochemistry data within the Exploration Data Workspace. The platform preserved source values while providing normalized fields for analysis. Geologists could review every mapping, transformation, and calculation before using the data.
Benefits included:
A clean geochemistry workspace ready for interpretation.

Geochemistry Standardization
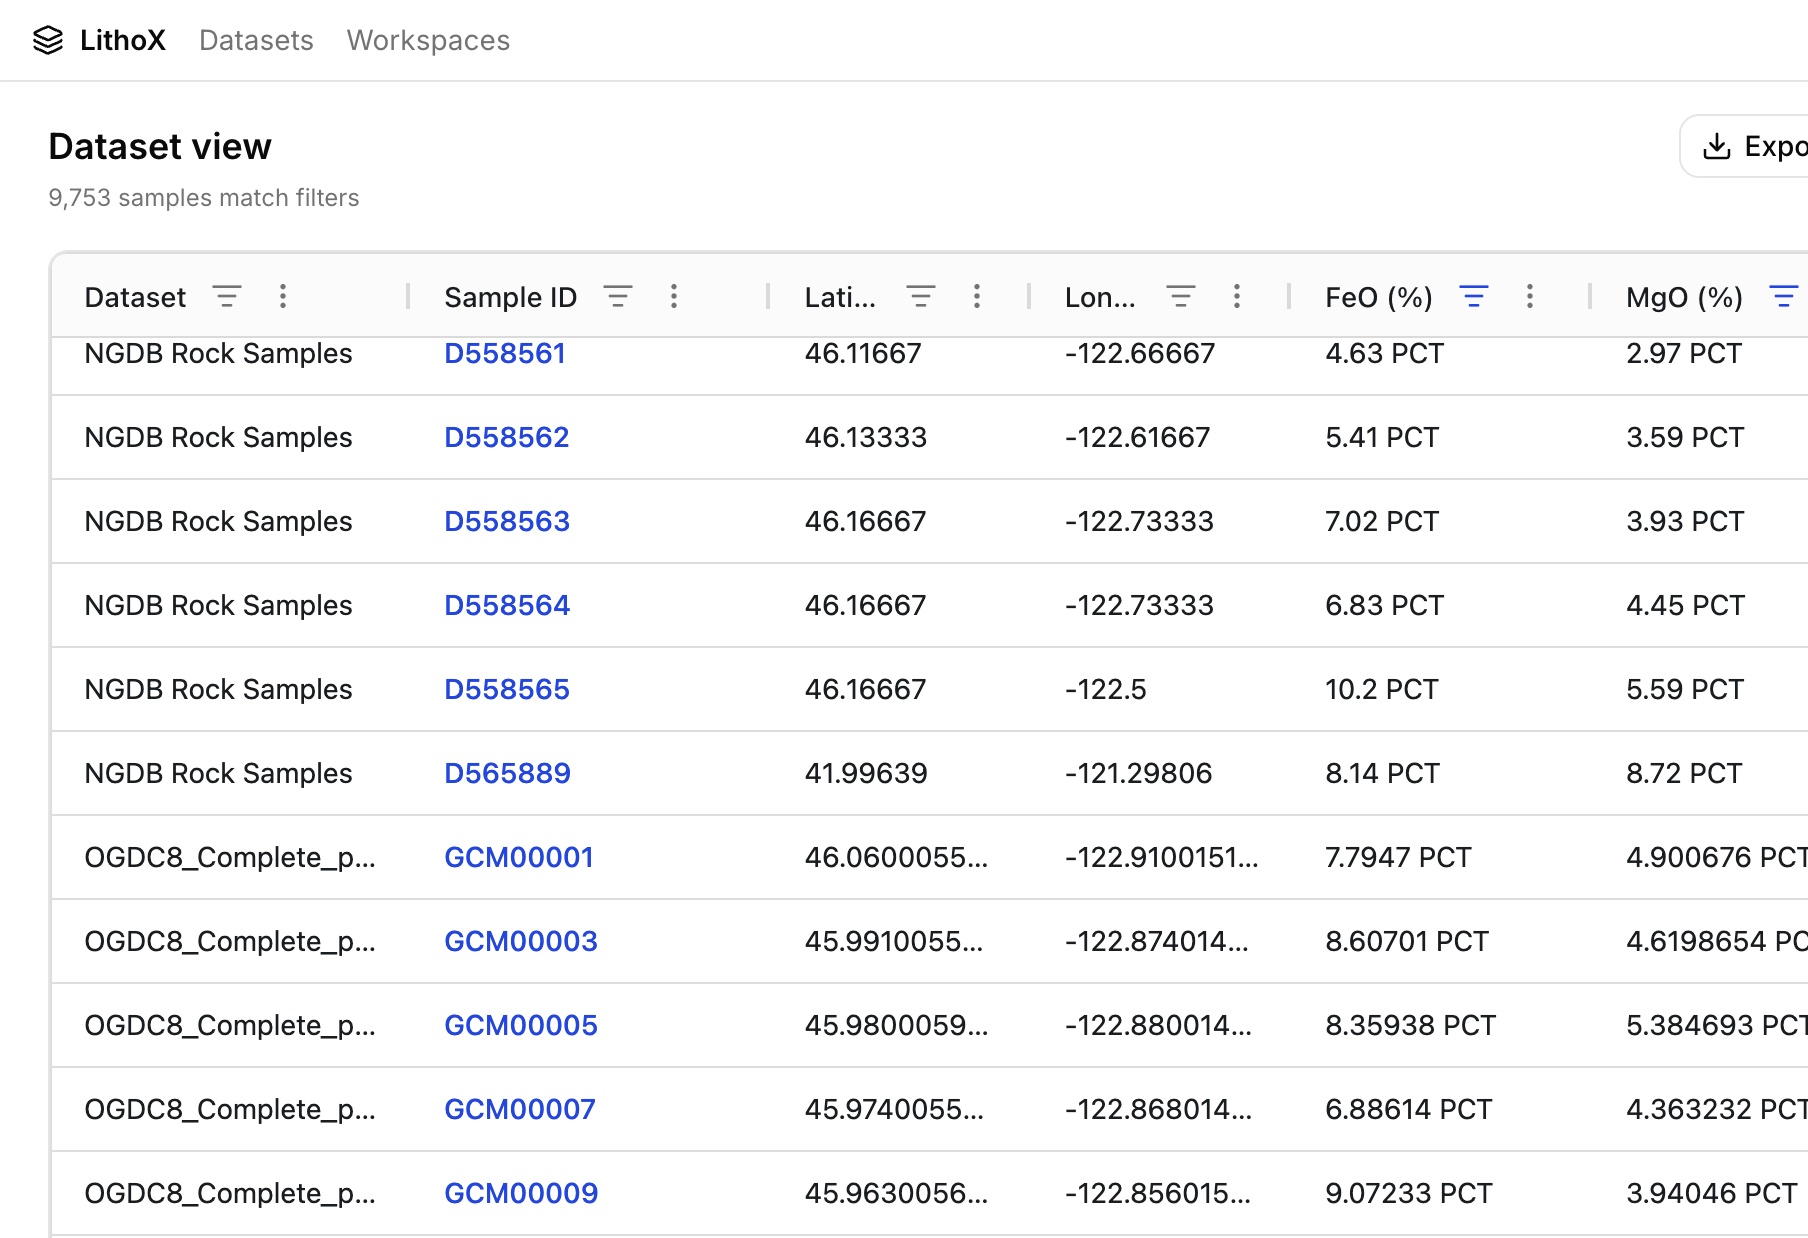
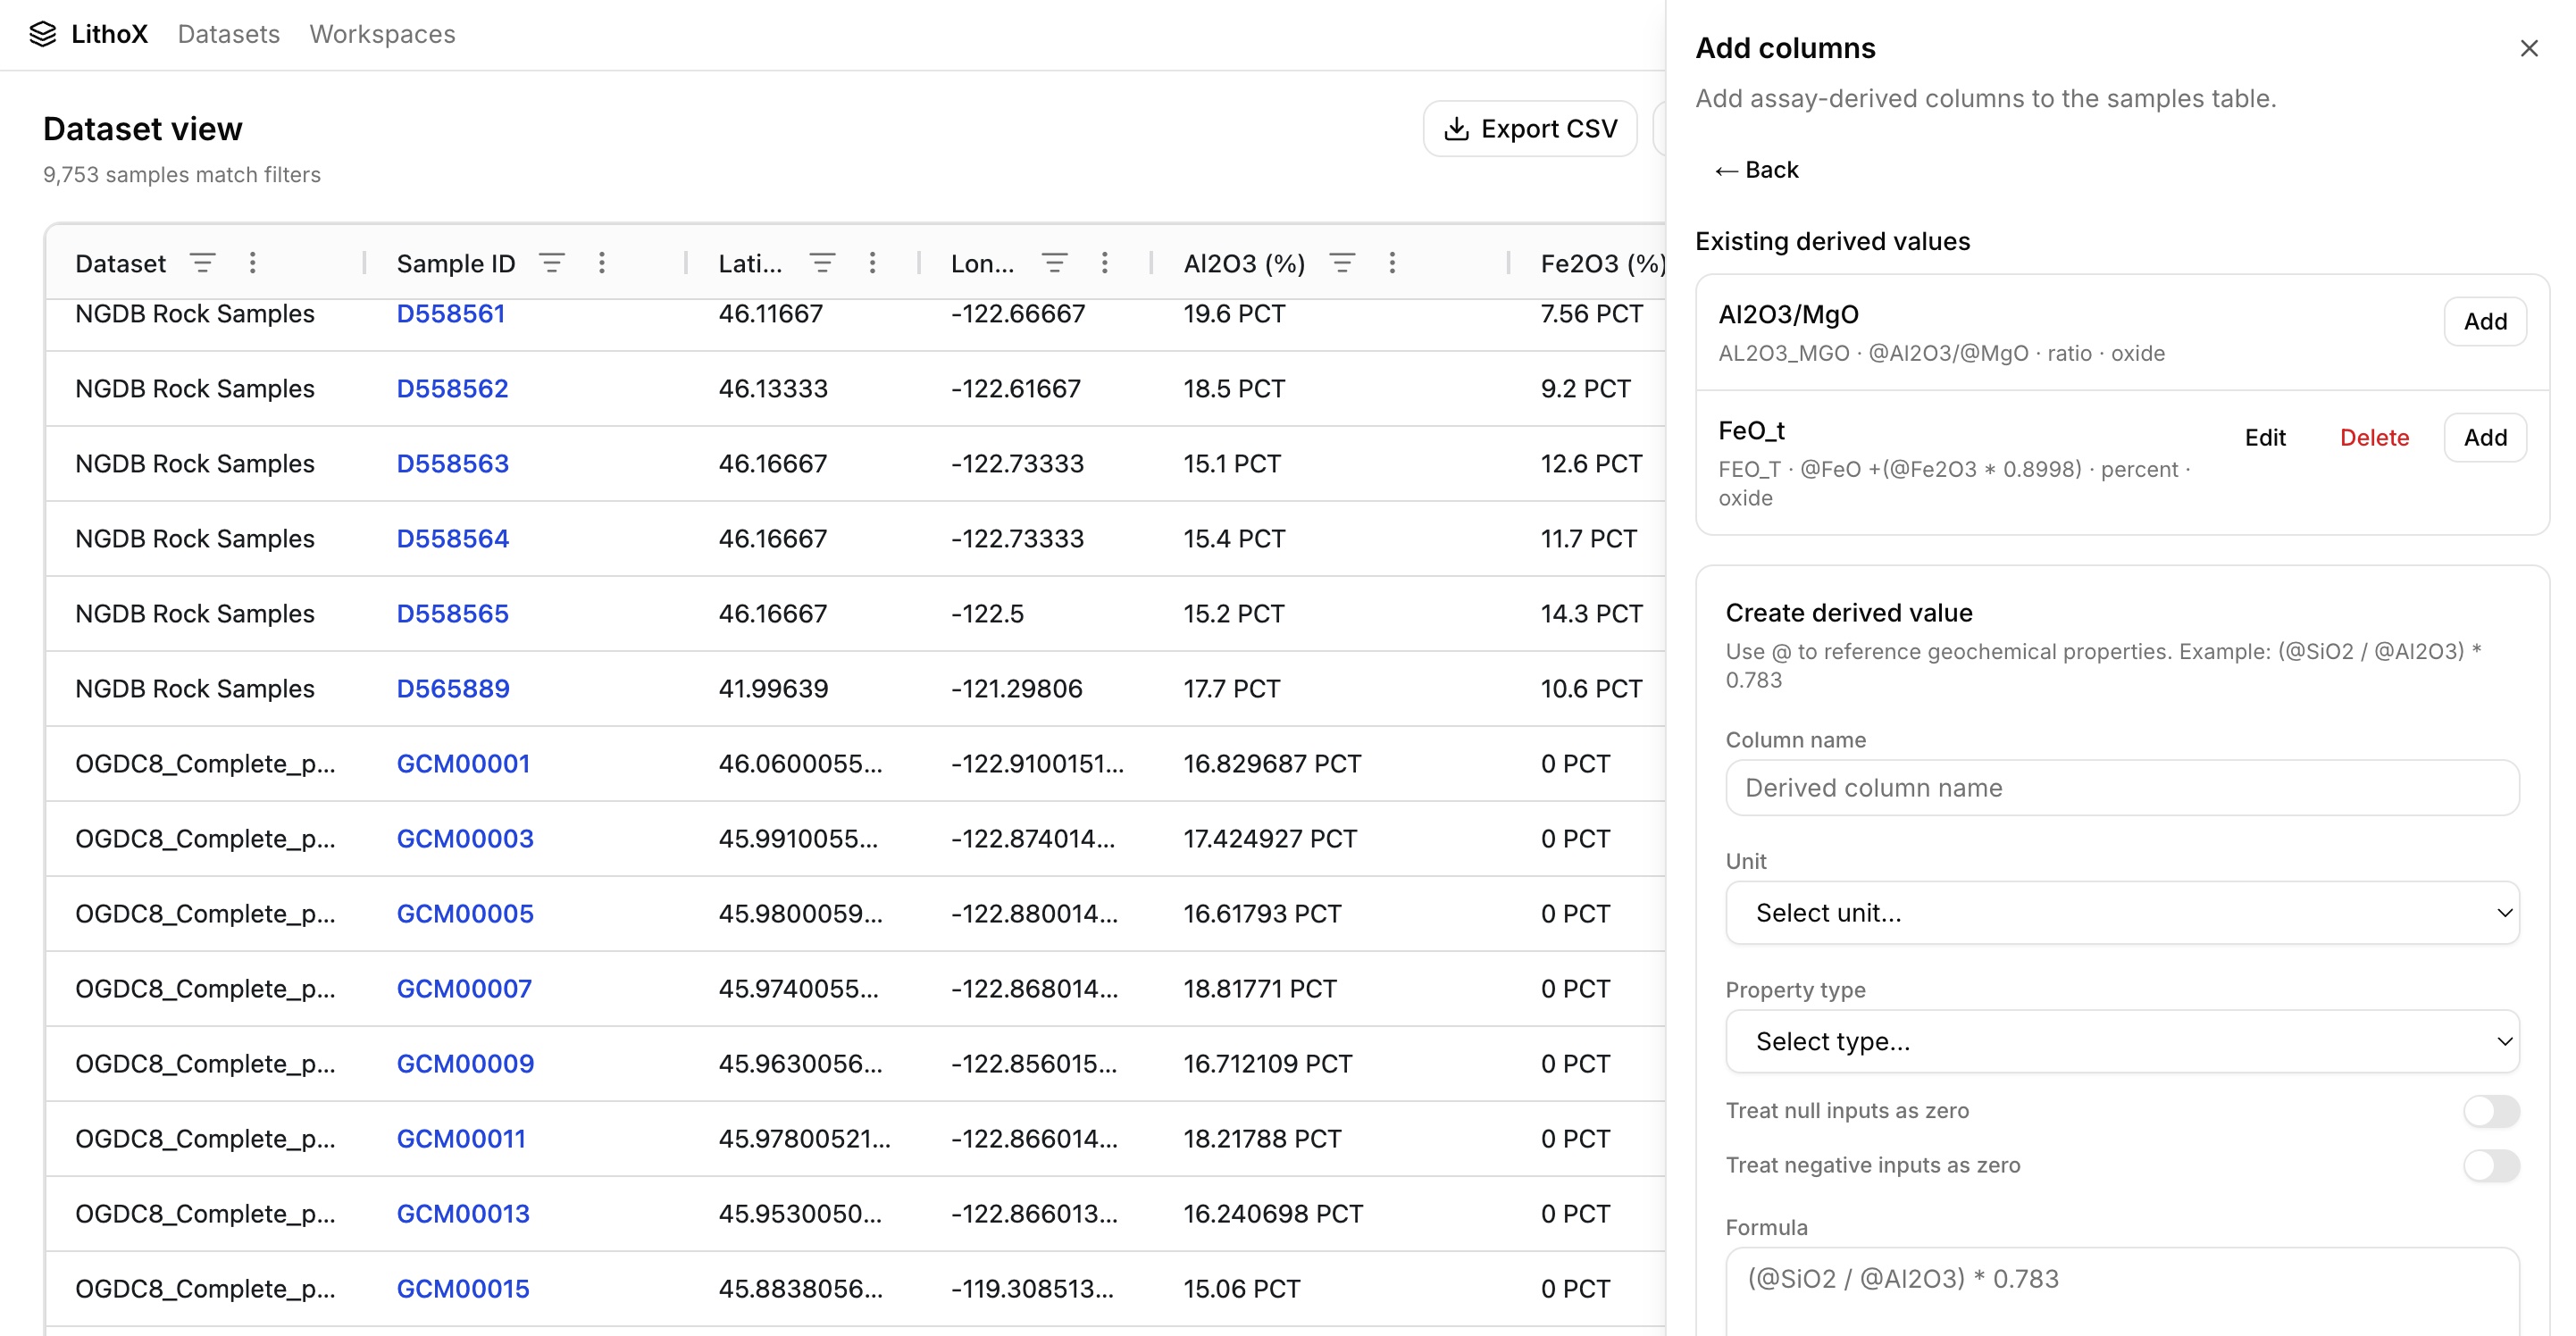
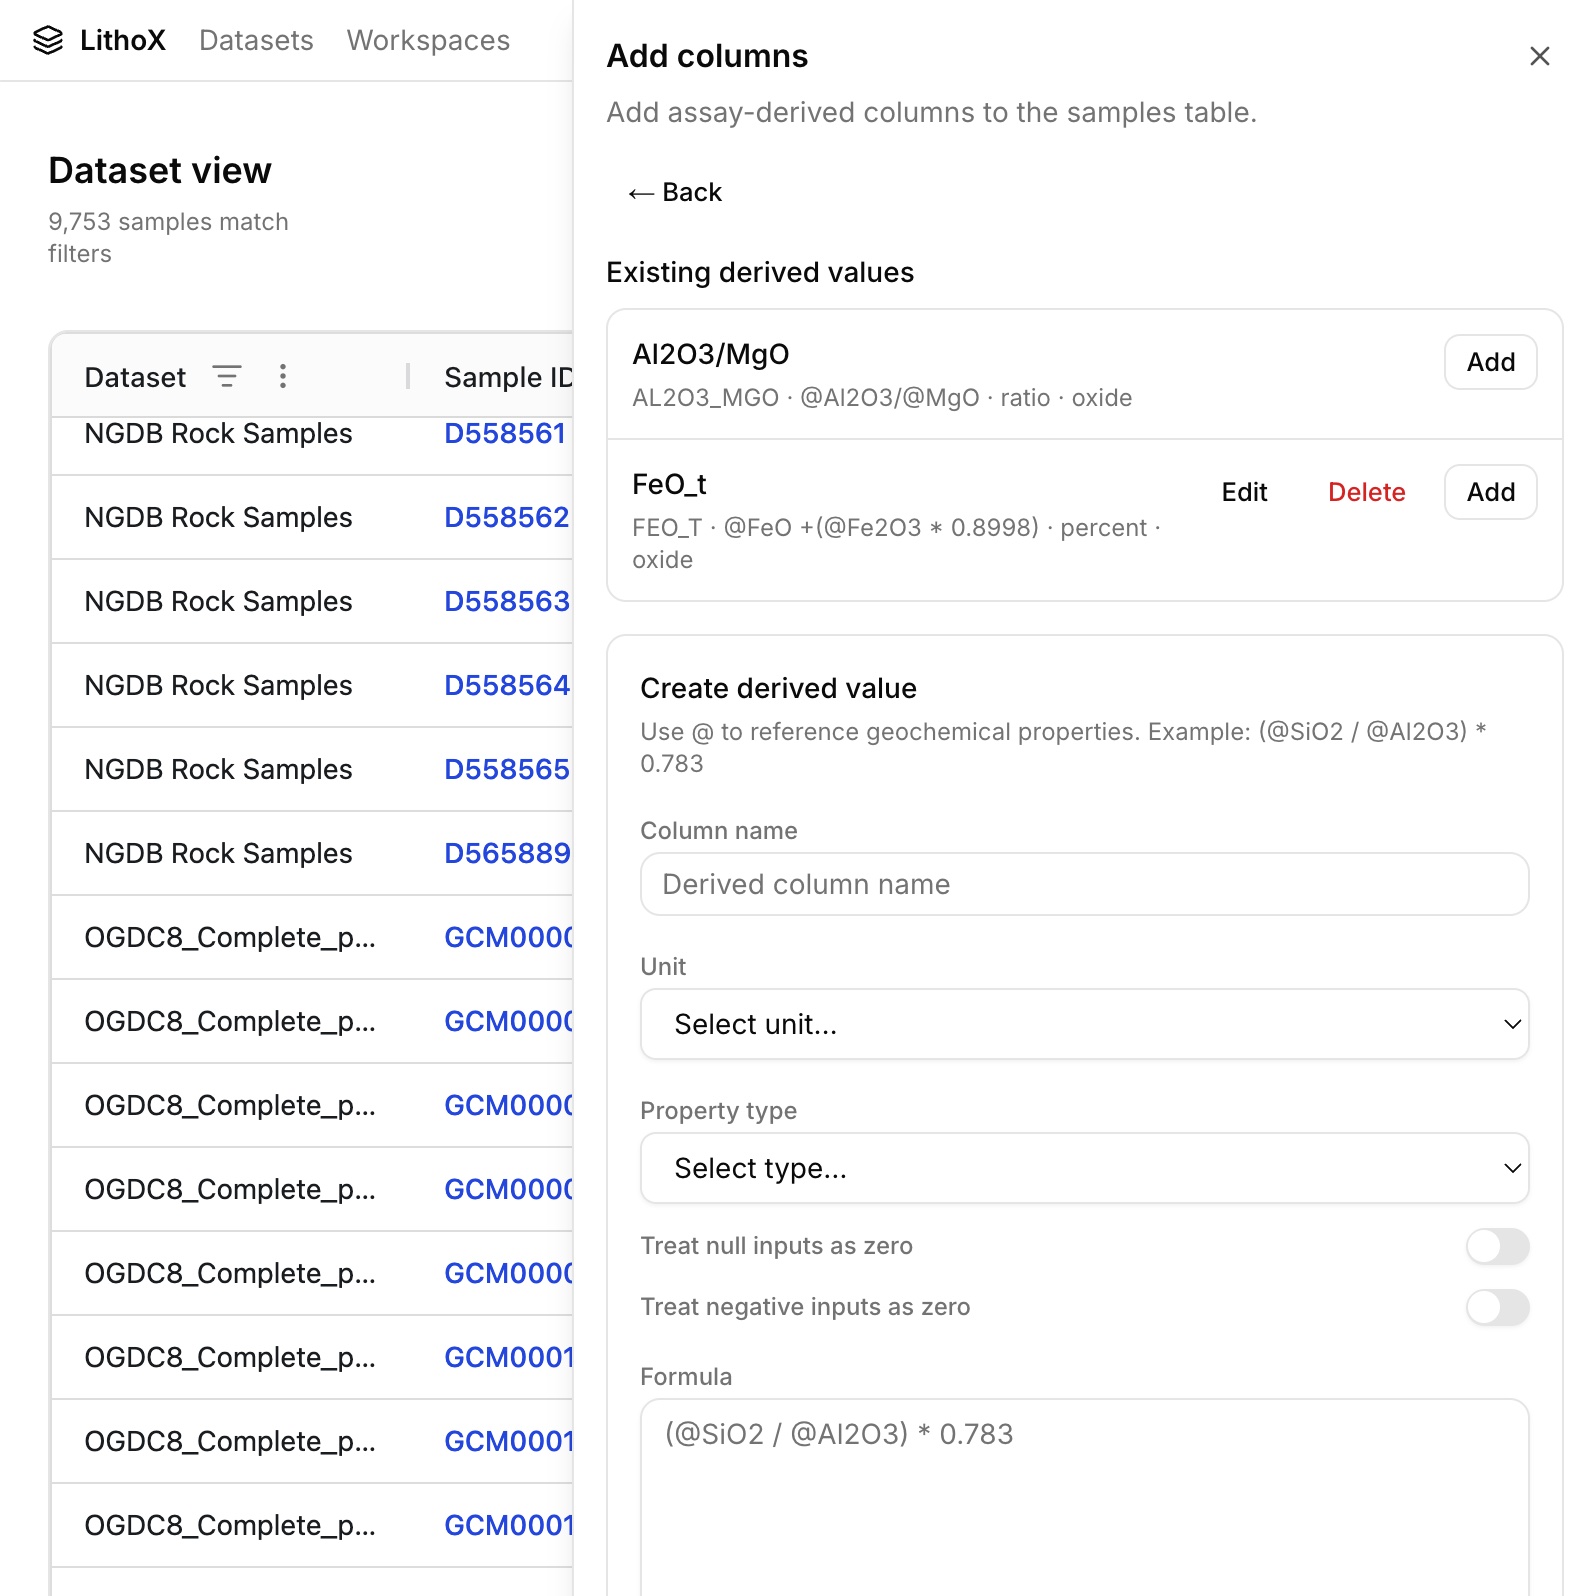
With standardized data in two clicks DOGAMI could combine the rock samples from the NDGB and OGDC-8 datset together. To support cross-dataset analysis, DOGAMI used LithoX formula columns to calculate FeOt from FeO and Fe₂O₃ values. The calculation created a consistent total iron field across NGDB and OGDC-8 while preserving all original source measurements. Because every calculation and mapping is tracked, geologists could easily review how the final FeOt value was derived from standardized and raw source data. What would typically require manual spreadsheet work was completed in seconds.
Benefits included:
Output: a consistent FeOt field for plotting across NGDB and OGDC-8, generated in seconds.
Rock Type Standardization
OGDC-8 contained many variations of rock names but no dedicated igneous classification field. LithoX had already standardized rock names into consistent categories, allowing DOGAMI to quickly isolate igneous samples for analysis. Every mapping remained reviewable and traceable back to the original source value.
Benefits included:
Output: a trusted igneous-only dataset ready for plotting.
From
Original OGDC-8 rock names
LithoX mapping
To
Standardized rock classifications
LithoX GIS
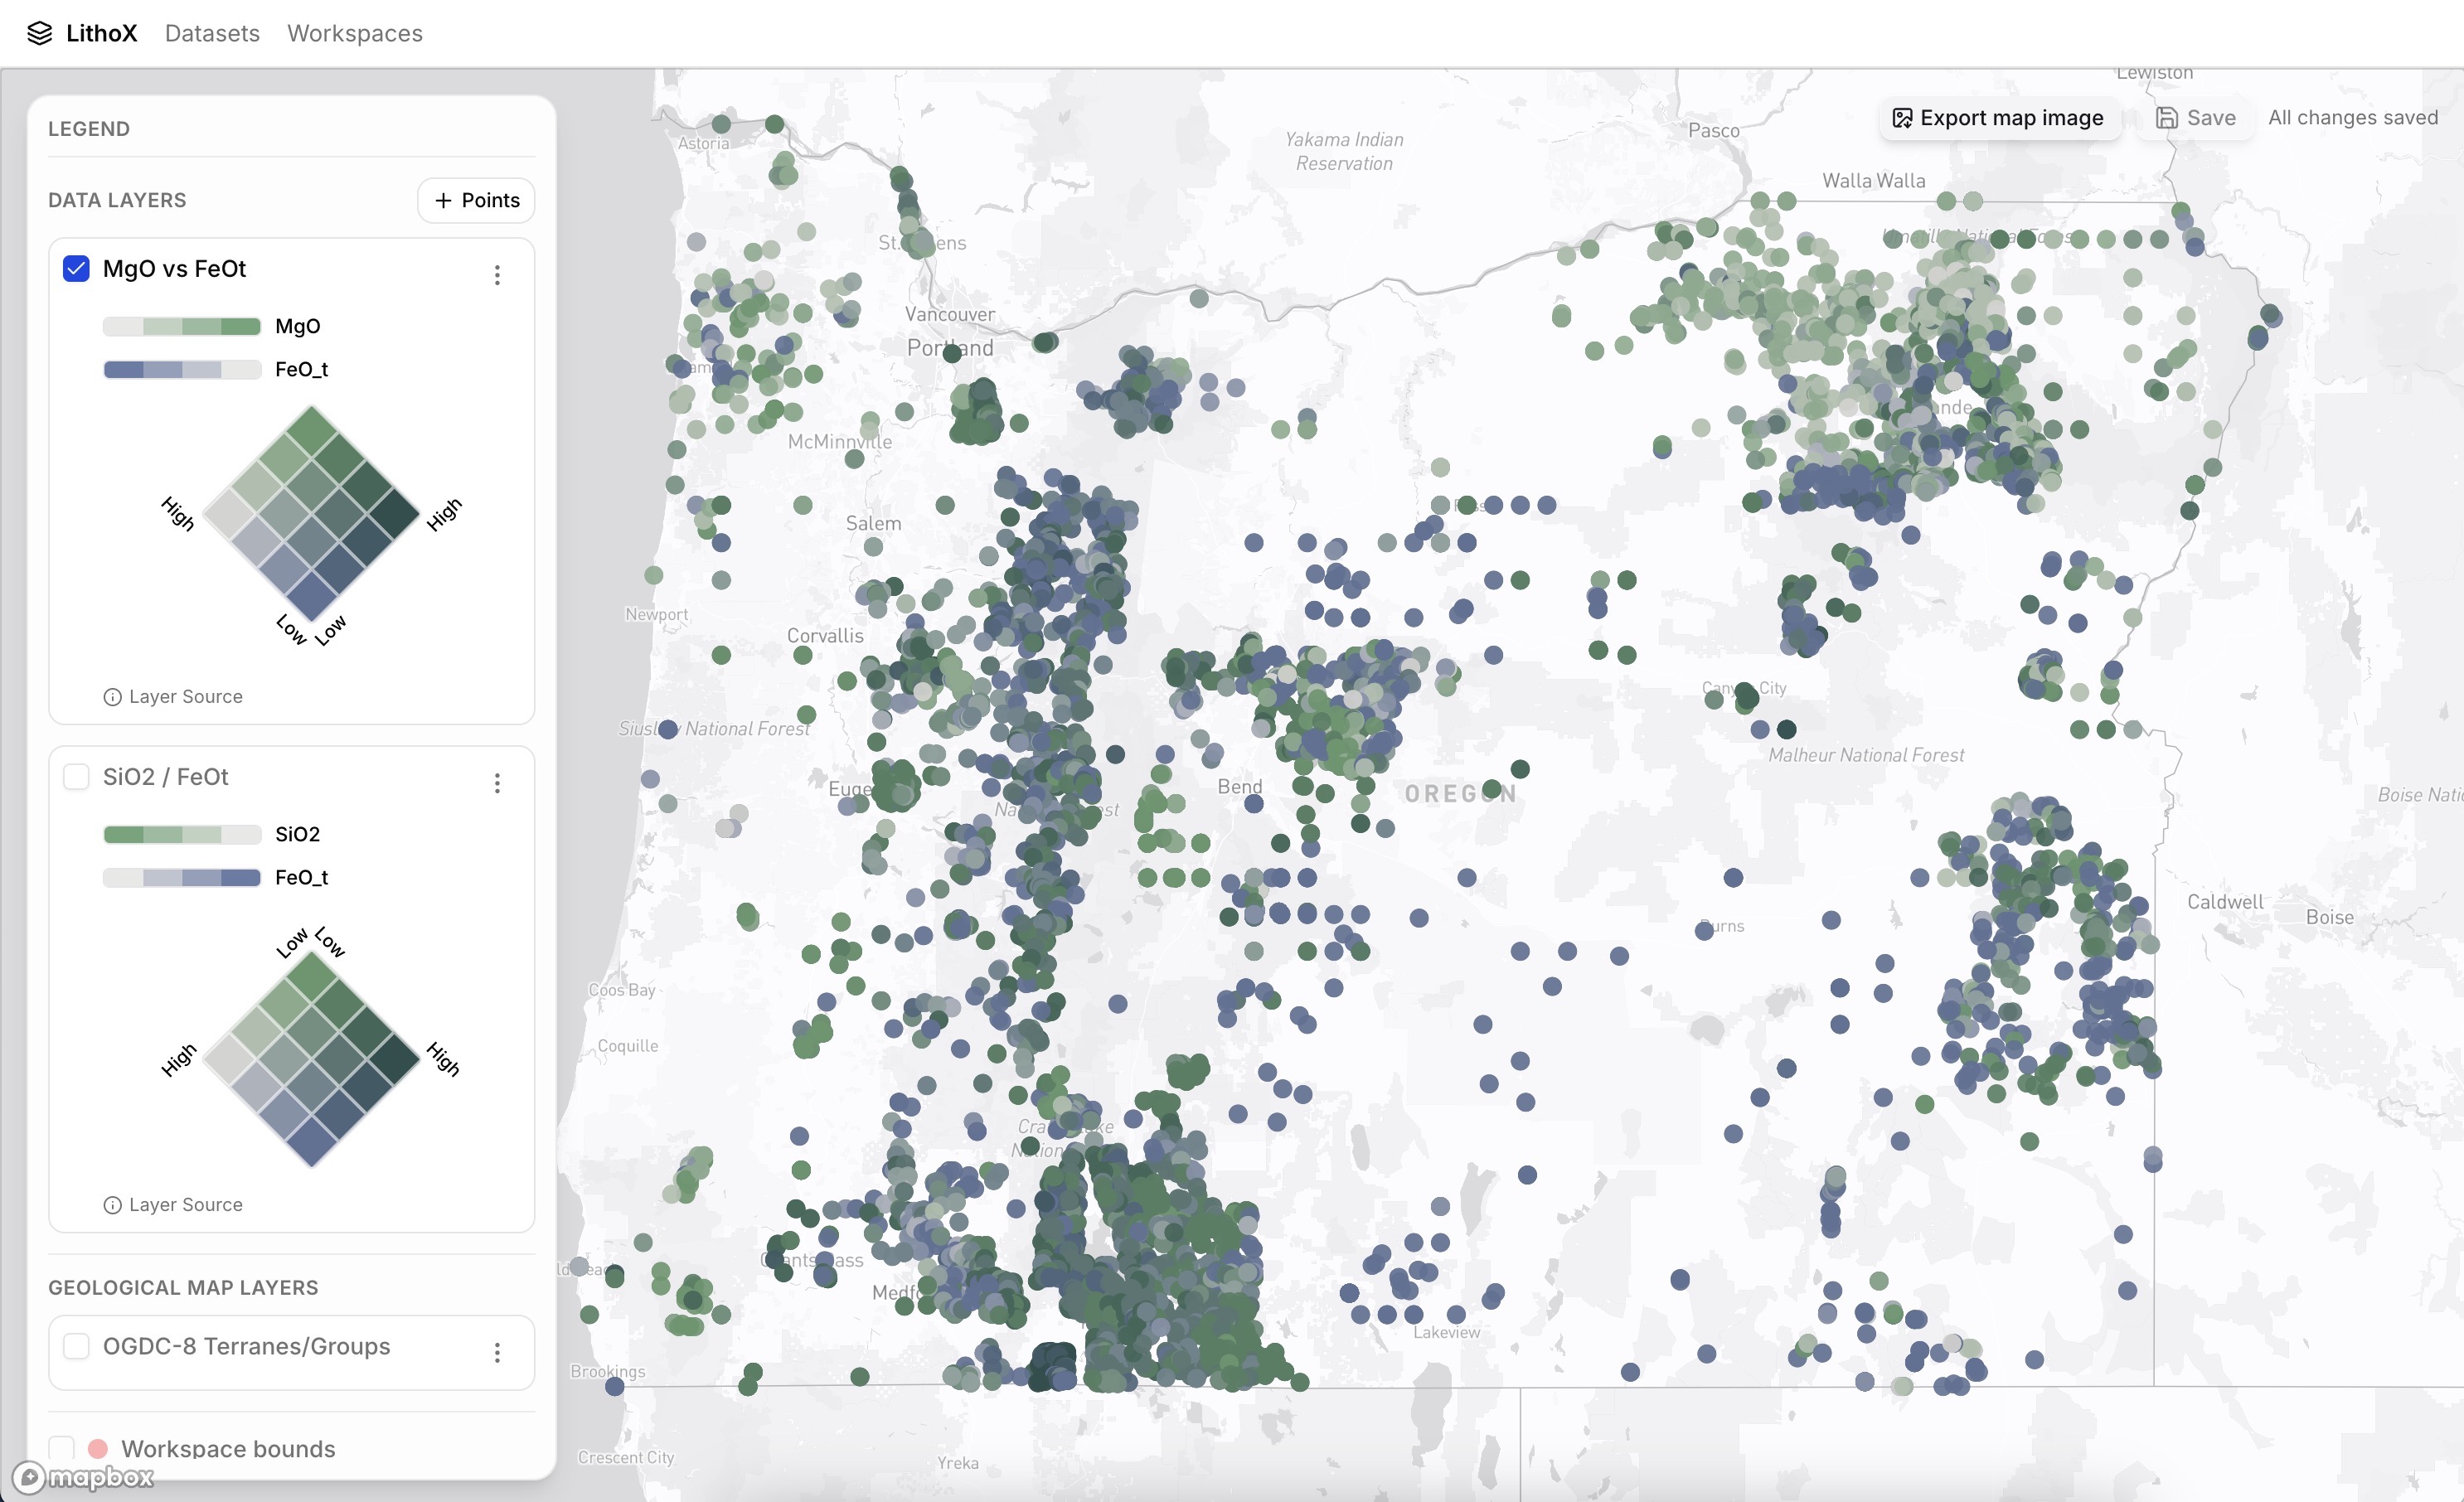
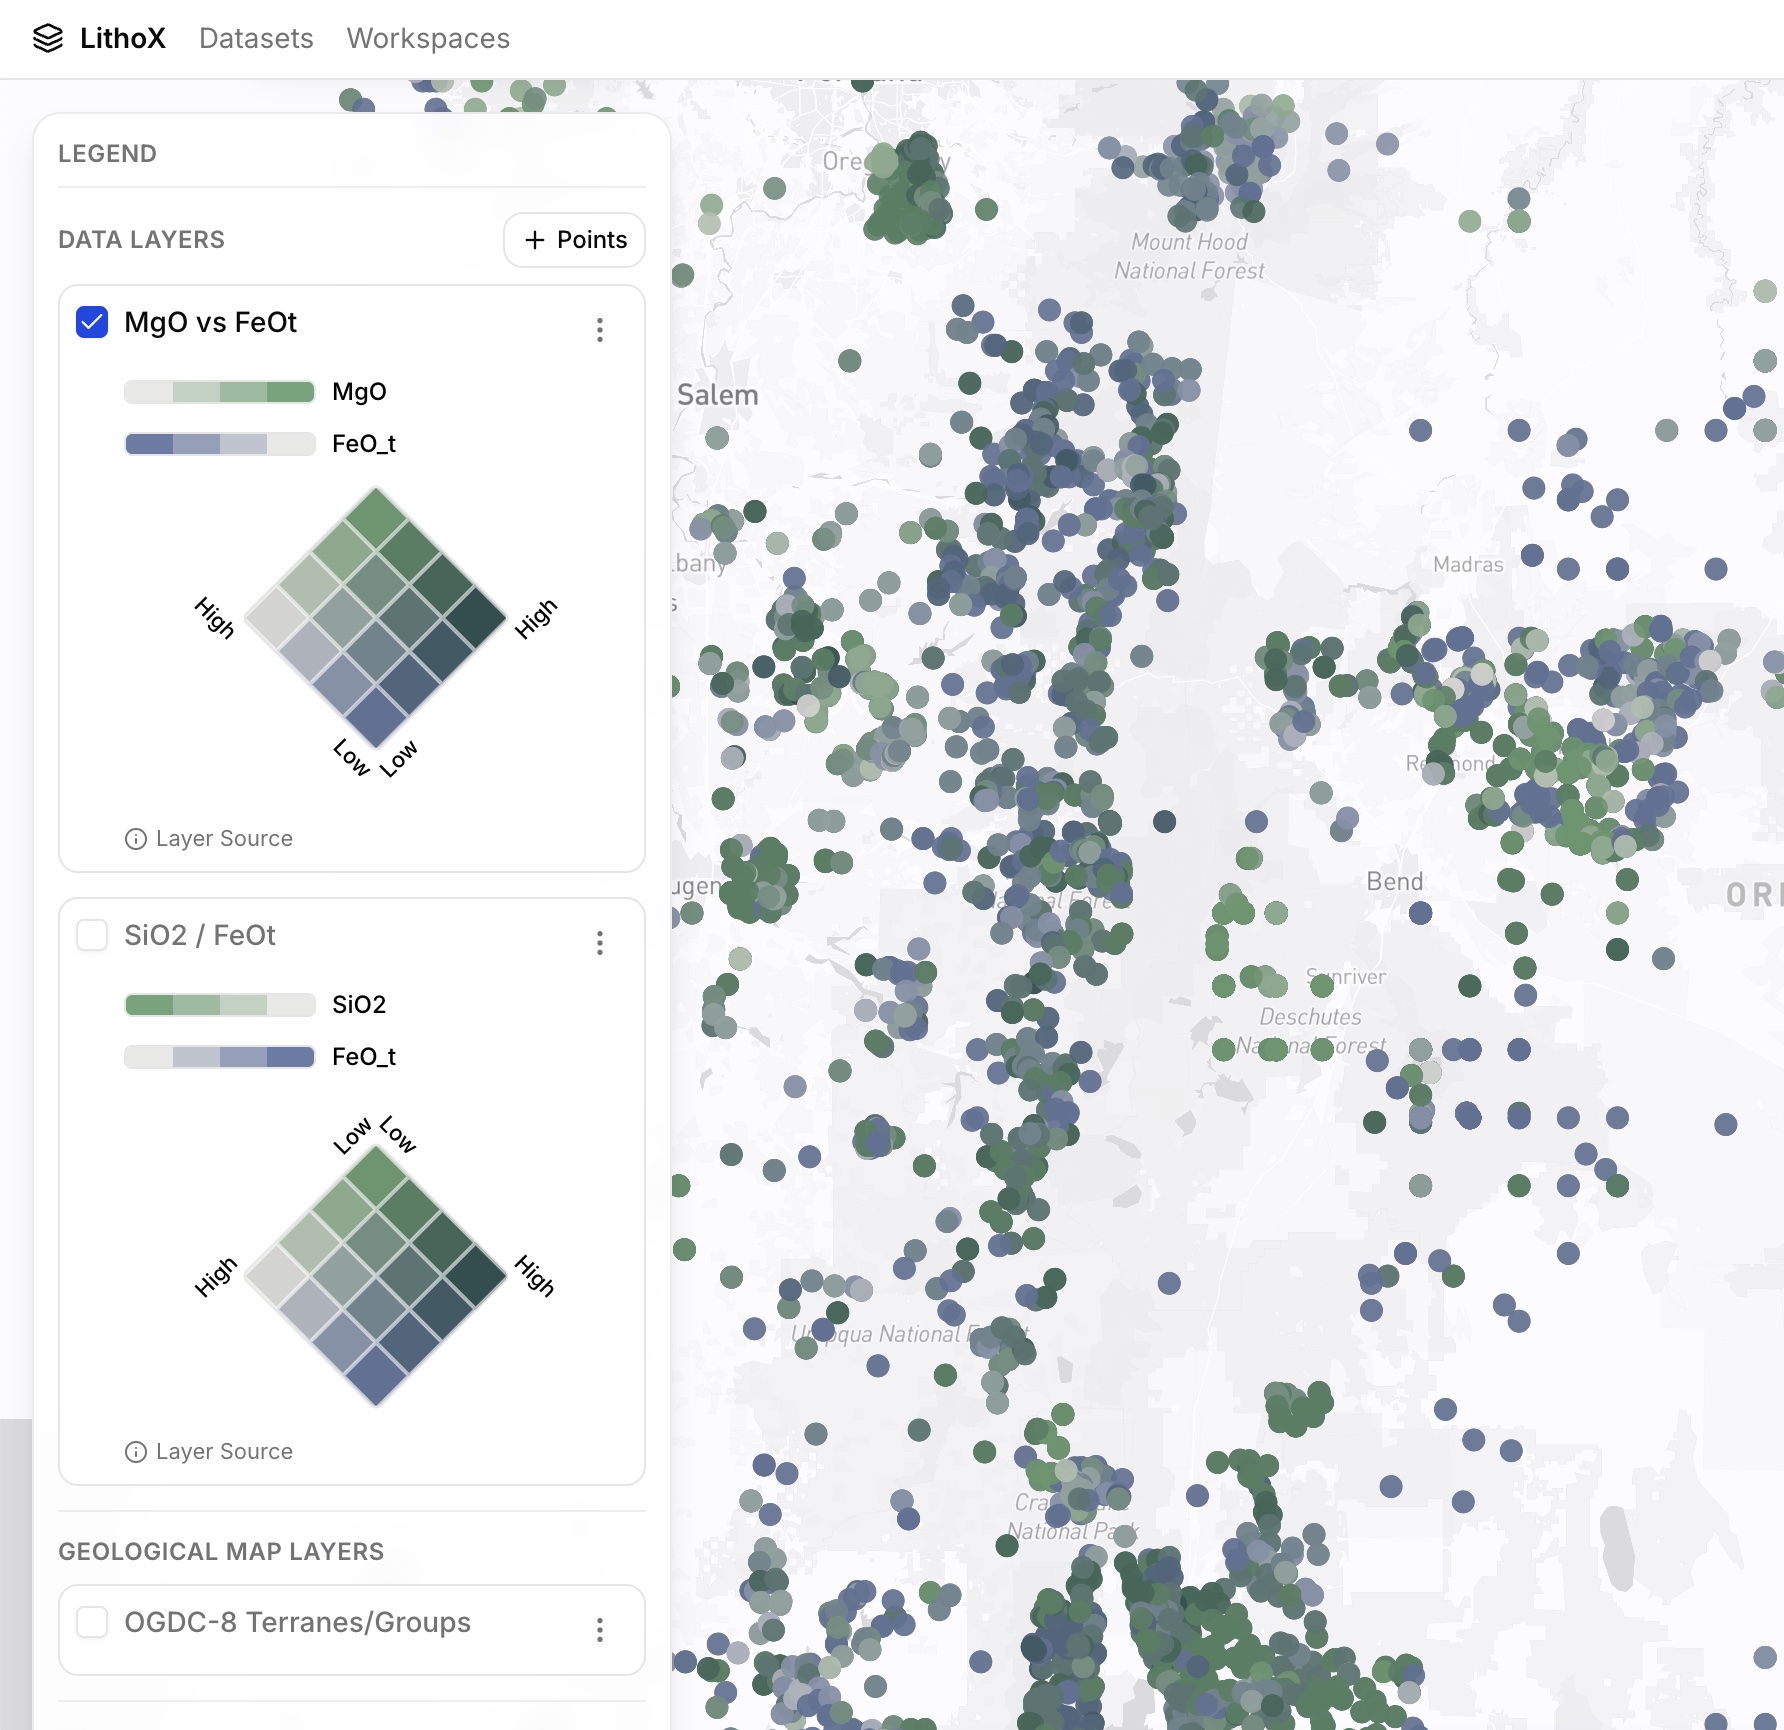
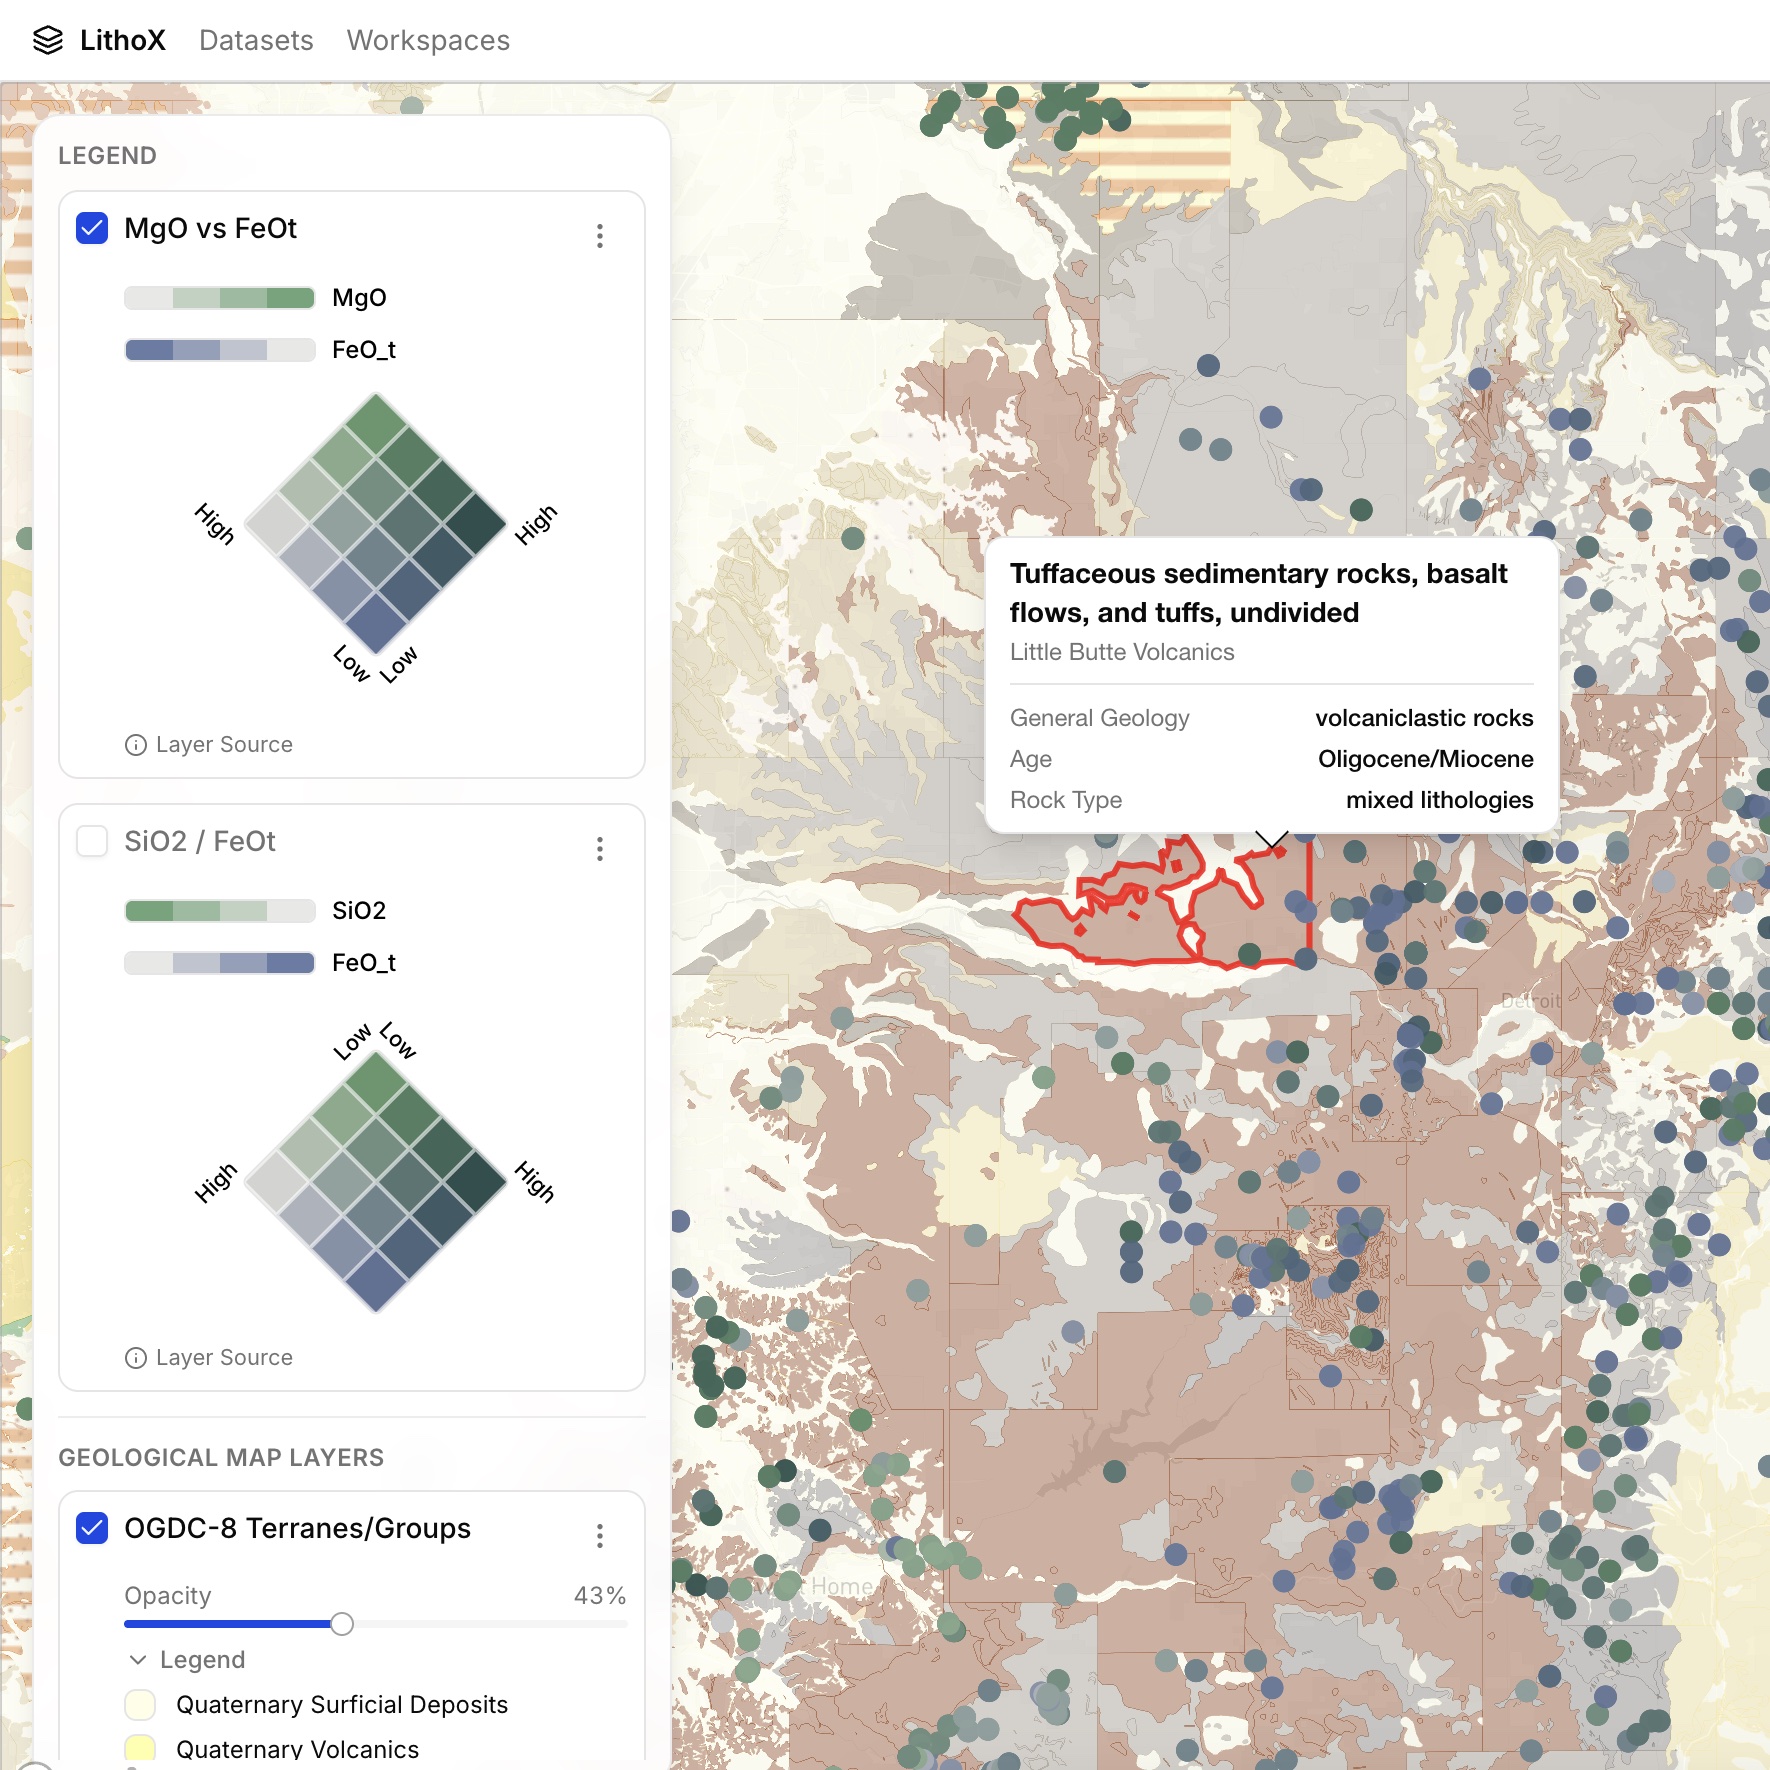
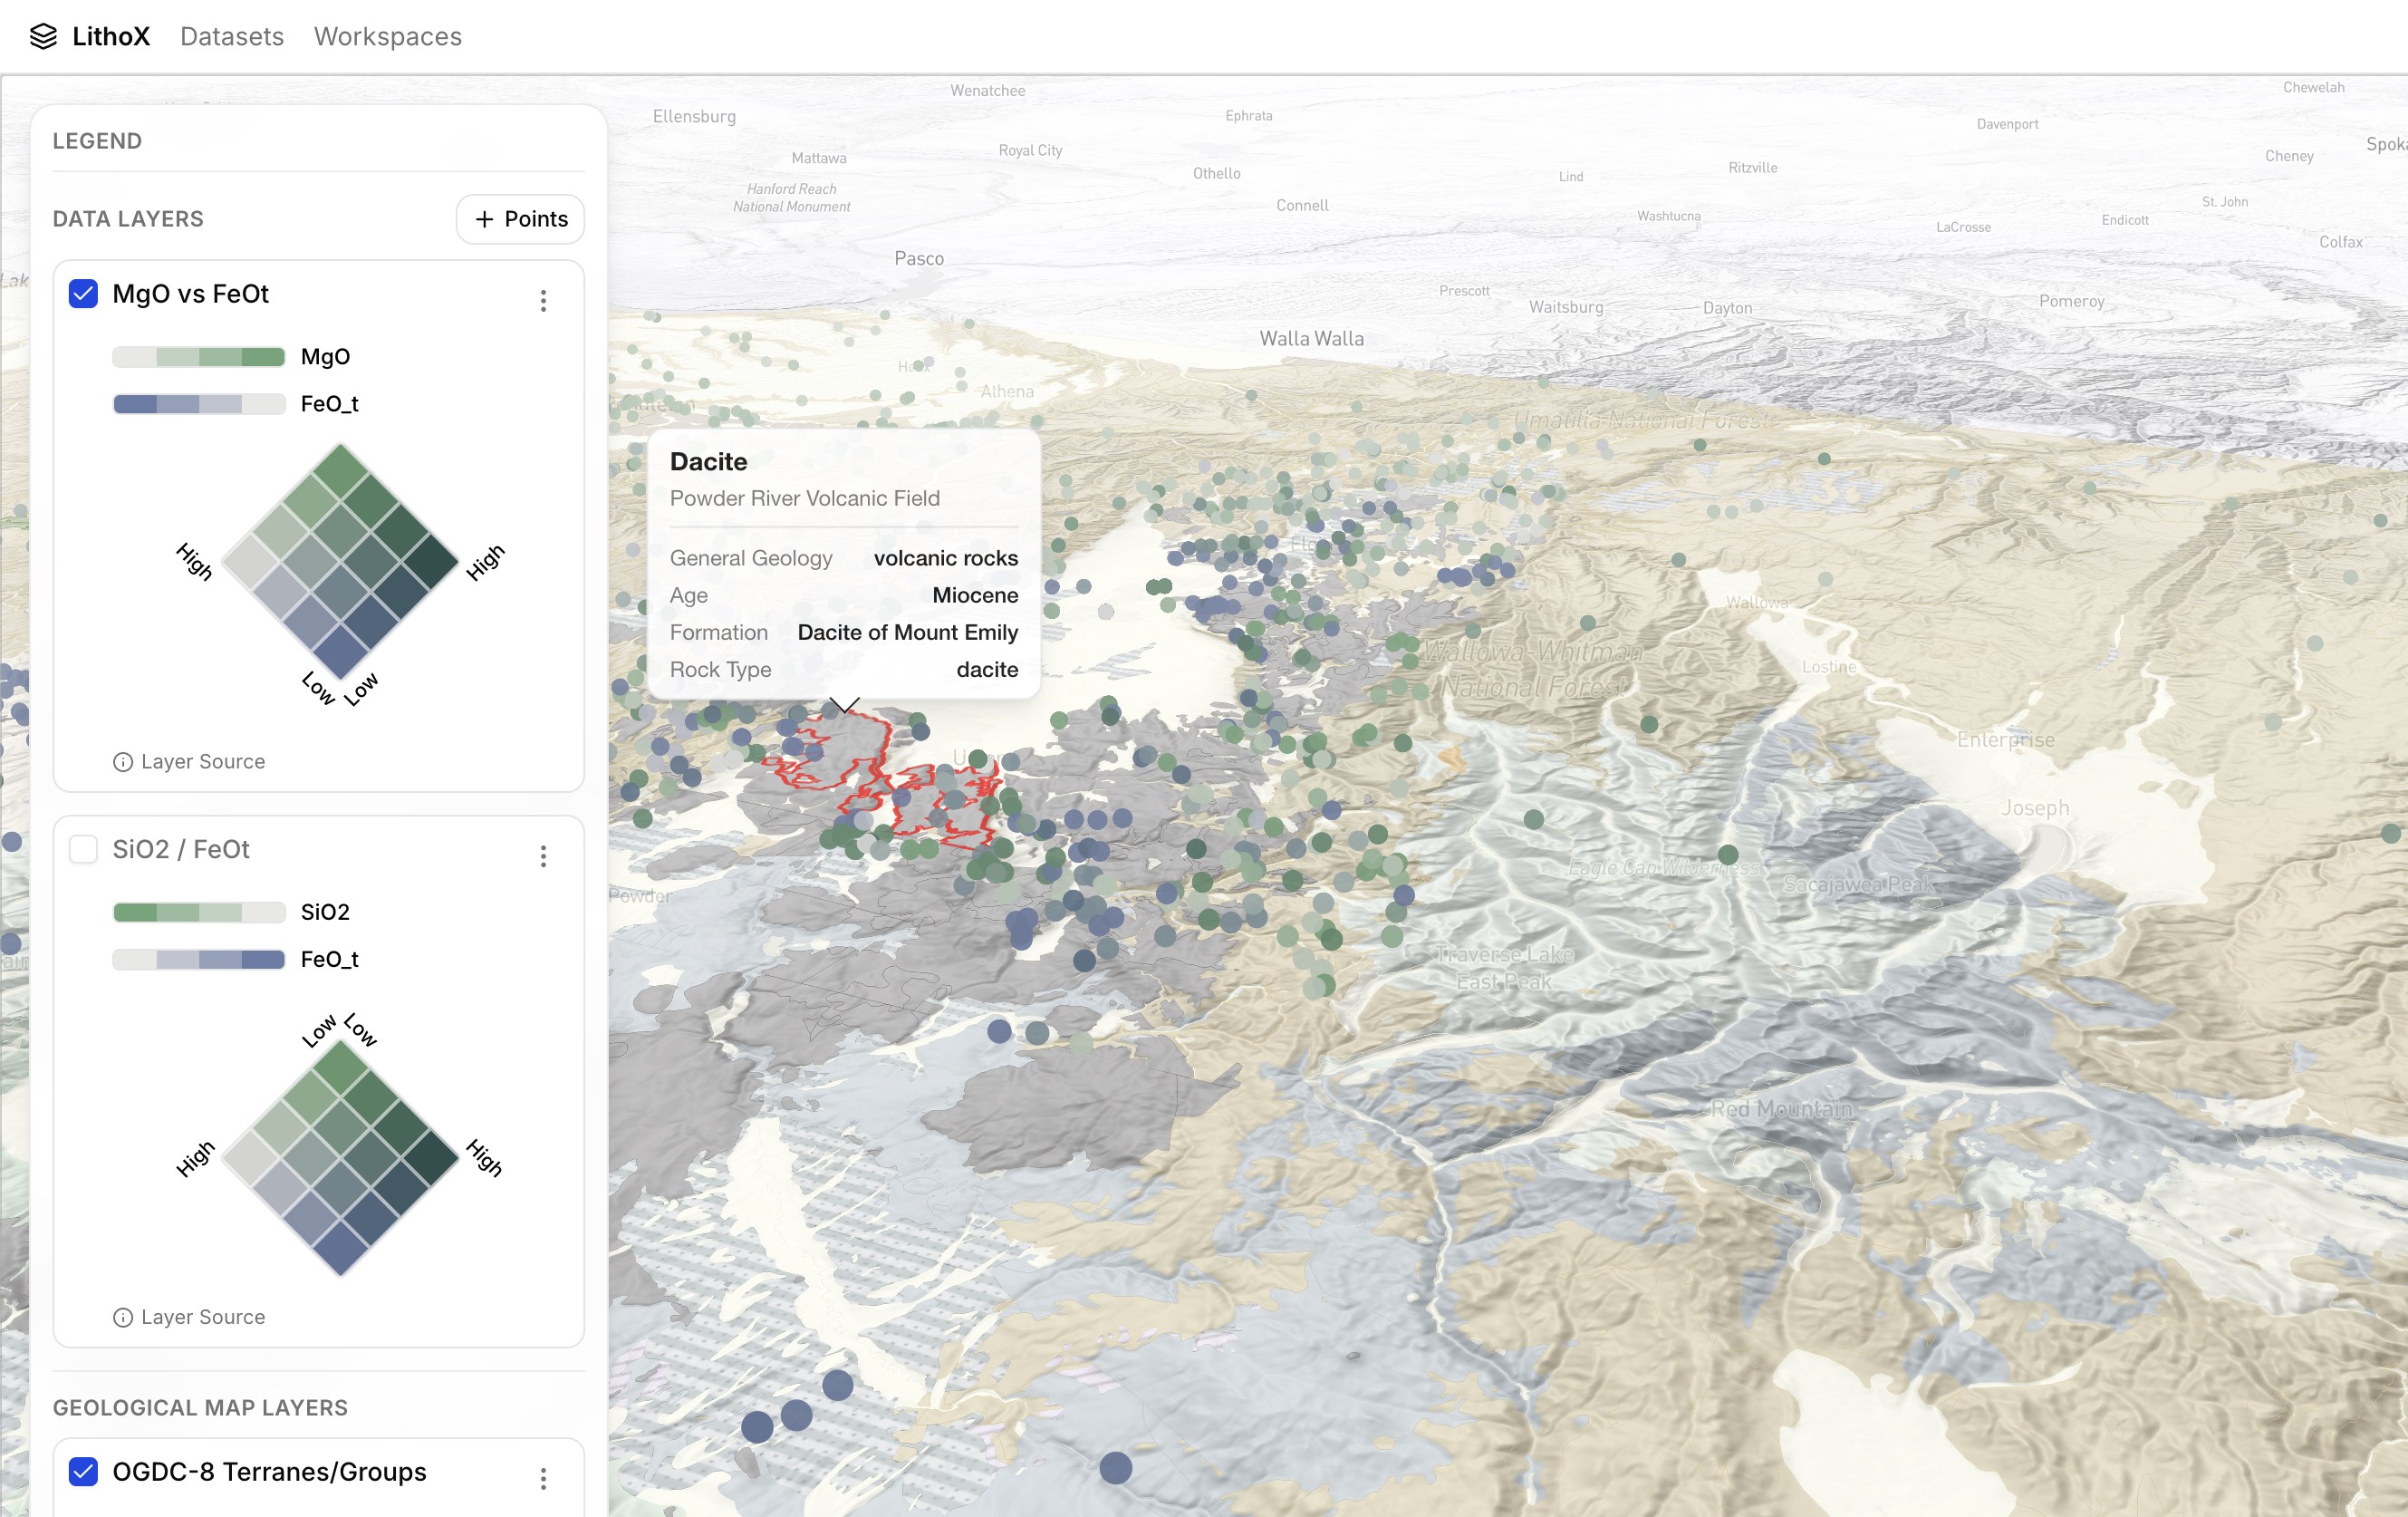
With standardized data available in the Exploration Data Workspace, DOGAMI used LithoX GIS to generate geochemical visualizations directly from the data. The team overlaid sample points on the DOGAMI Oregon geological map and produced bivariate maps including SiO₂ vs FeOt and MgO vs FeOt to highlight areas potentially more prospective for stimulated hydrogen exploration.
Benefits included:
Output: geochemical maps and plots generated directly from trusted standardized data.
Cloud-first GIS
Because LithoX is cloud-first by default, the same data, maps, plots, and workflows were immediately available on any device without additional setup. For the poster session, DOGAMI opened LithoX GIS directly on an iPad and presented an interactive version of the project using the exact same datasets and visualizations used during analysis.
There was no need to export files, transfer data, synchronize projects, or prepare a separate presentation environment. During discussions with other geologists, the team could create new maps on the fly, adjust visualizations, apply filters, and test alternative interpretations in real time — including generating maps of rock samples colored by Al₂O₃/MgO directly from the standardized geochemistry data while standing at the poster.
Benefits included:
Output: fully interactive exploration available on an iPad during the poster presentation, with no exports, transfers, or synchronization steps.
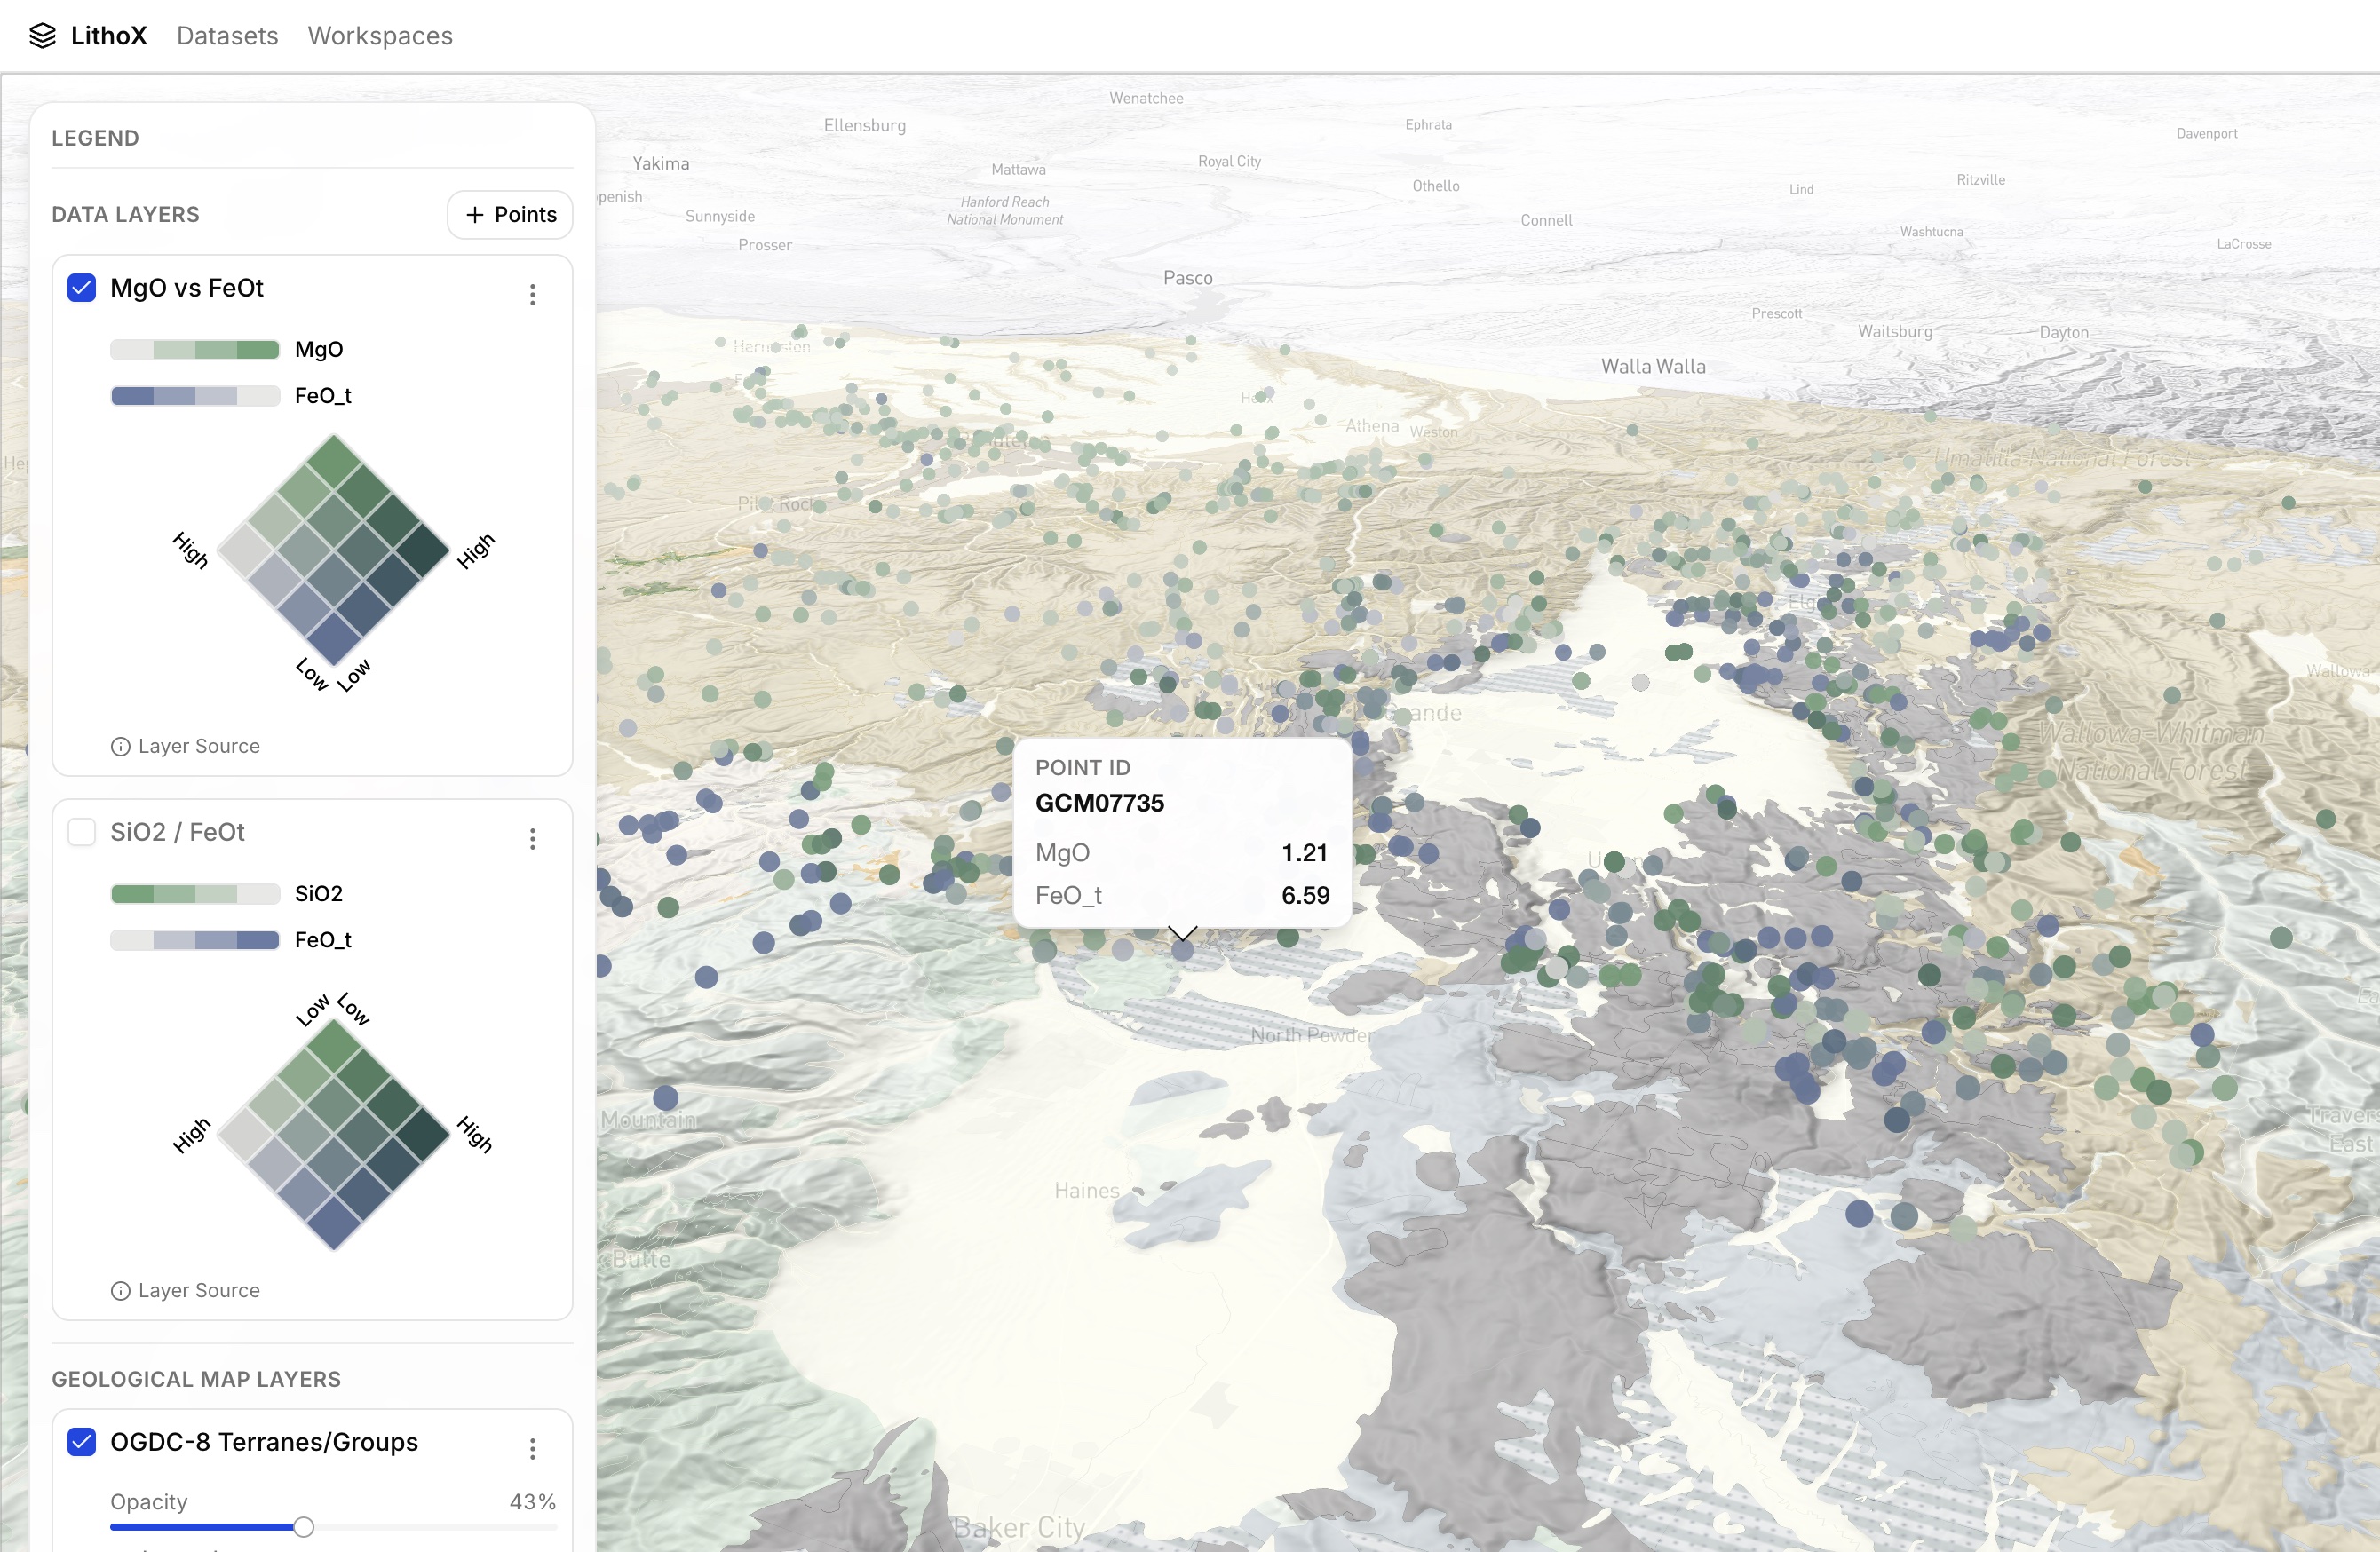
LithoX GIS on iPad
Workflow Summary
Access preloaded NGDB and OGDC-8 geochemistry data.
Inspect mappings, calculations, and lineage before analysis.
Use formula columns to generate a consistent FeOt field from FeO and Fe₂O₃ measurements across datasets in seconds.
Use standardized rock classifications to isolate relevant samples.
Create SiO₂ vs FeOt and MgO vs FeOt visualizations using LithoX GIS.
Open the same project in LithoX GIS on an iPad and continue working with the exact same datasets, maps, and plots used during analysis. Create additional visualizations, such as Al₂O₃/MgO maps, without exporting files, transferring data, or performing any synchronization.
Focus on identifying areas potentially prospective for stimulated hydrogen exploration.
Spend more time on analysis and less time on data cleaning. Get in touch about your next project.